UK House Price Heat Map
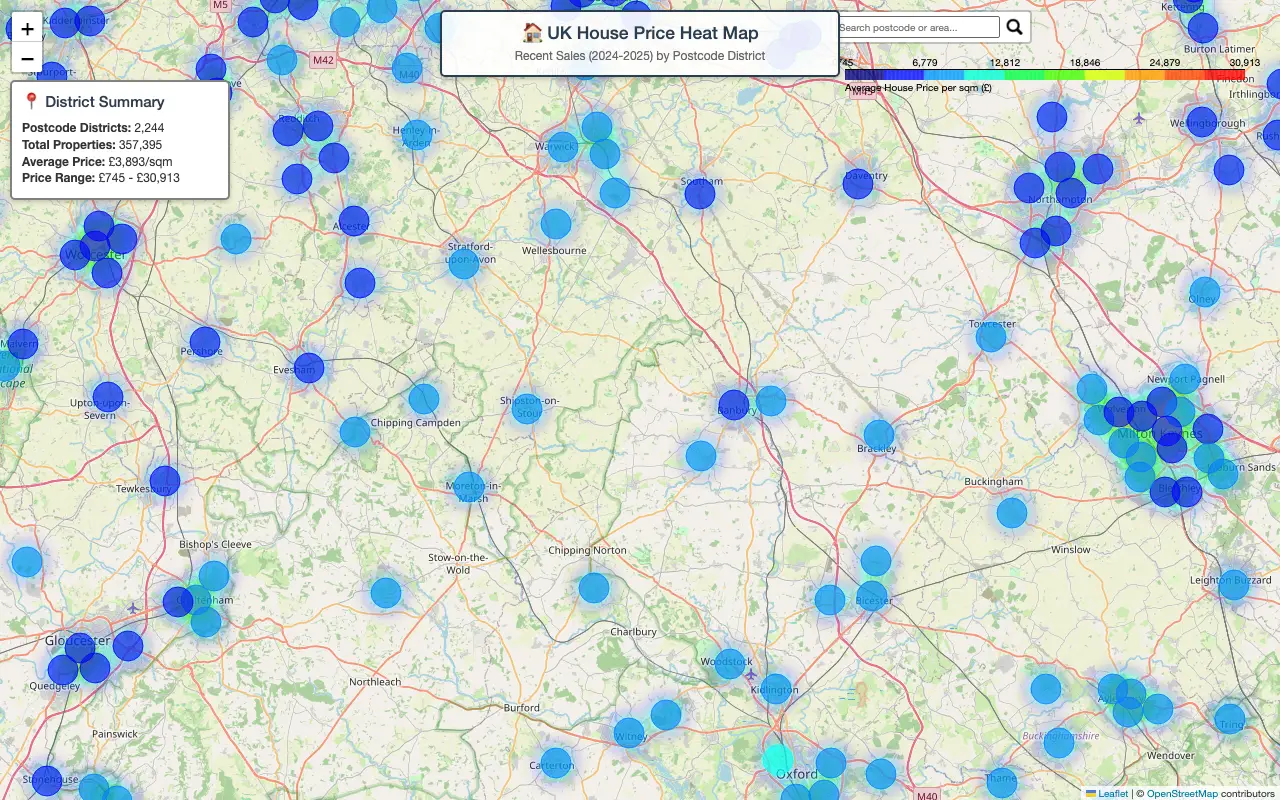
Interactive map showing average house prices by UK postcode district
 Visit davkap92.github.io ↗
What is UK House Price Heat Map?
An interactive heat map displaying recent UK residential property sales data from 2024–2025, organized by postcode district. The tool visualizes average prices per square meter across 2,244 postcode districts covering 357,395 properties, with prices ranging from £745 to £30,913 per sqm. Users can explore regional price variations through a color-coded map interface powered by Leaflet and OpenStreetMap.
The creator built this using AI coding tools to process and visualize the latest UK postal data. It serves property researchers, real estate professionals, and anyone interested in understanding housing market trends across different UK regions at a granular level.
Momentum
Daily activity over the last 30 days: upvotes, unique visits, new GitHub stars and Hacker News points.
How do we know it's vibe coded?
vibetrend discovered UK House Price Heat Map automatically. Evidence: HN post: "Vibe coded using latest uk postal data". View source.
Similar vibe-coded apps
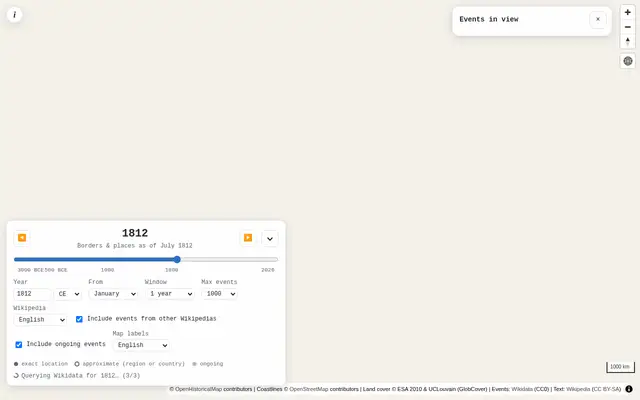
Explore historical events on period-accurate maps with contemporaneous context

Visualize Wikipedia article connections mapped to geographic locations

Real-time breaking news feed from 650+ sources with no algorithm

Real-time tracker for NASA's Artemis Moon missions with live telemetry

Interactive explorer of Senator Rand Paul's July 2026 opening statement


Real-time global intelligence dashboard with live geopolitical signals