Meanwhile Map
Explore historical events on period-accurate maps with contemporaneous context
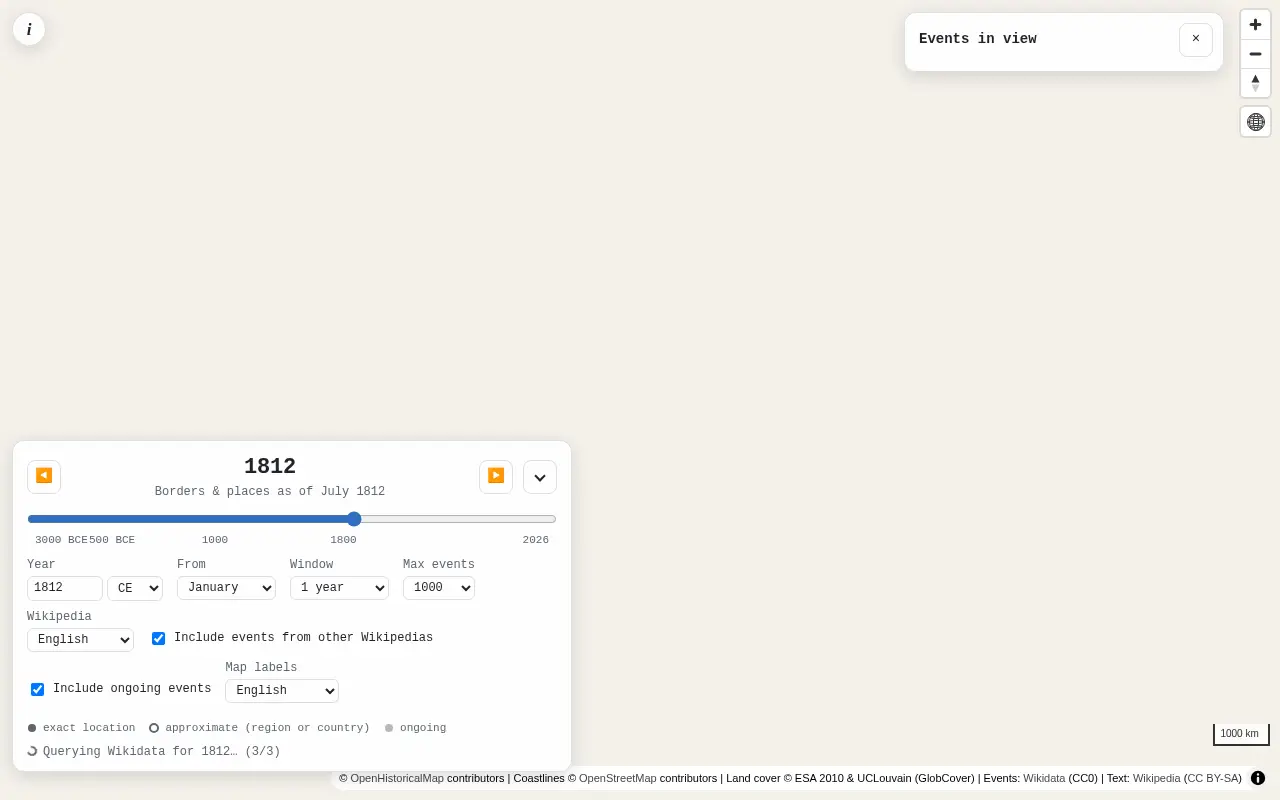 Visit meanwhilemap.com ↗
What is Meanwhile Map?
Meanwhile Map displays historical events from Wikipedia and Wikidata on OpenHistoricalMap, showing what was happening around the world during a chosen time period. Select any year and time window from 1 month to 100 years, then explore a map with borders and place names matching that era. Events appear as pins with summaries and links to source materials; you can filter by category, zoom into clusters, and distinguish between exact locations, regional approximations, and ongoing events.
Built as a fully client-side static web page using open data sources, it requires no backend or personal tracking. The interface pulls live event data from Wikidata, renders historical maps via MapLibre GL JS, and retrieves summaries and images from Wikipedia. Code is open source on GitHub.
Momentum
Daily activity over the last 30 days: upvotes, unique visits, new GitHub stars and Hacker News points.
How do we know it's vibe coded?
vibetrend discovered Meanwhile Map automatically. Evidence: Show HN "Show HN: Meanwhile Map – what else was happening in the world at the same time": “com/ea/meanwhilemap/tree/main ), vibe coded as an experiment”. View source.
Similar vibe-coded apps
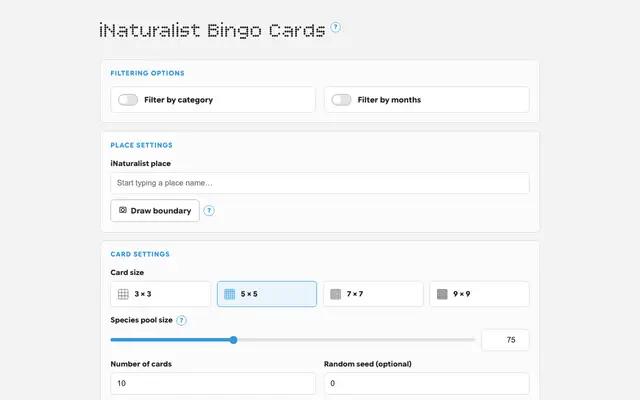
Generate printable bingo cards from real species observations in any location
Open-source French learning with grammar exercises and flashcards
Interactive explorer of Senator Rand Paul's July 2026 opening statement
Rhythm notation reading trainer — read notes and tap the rhythm
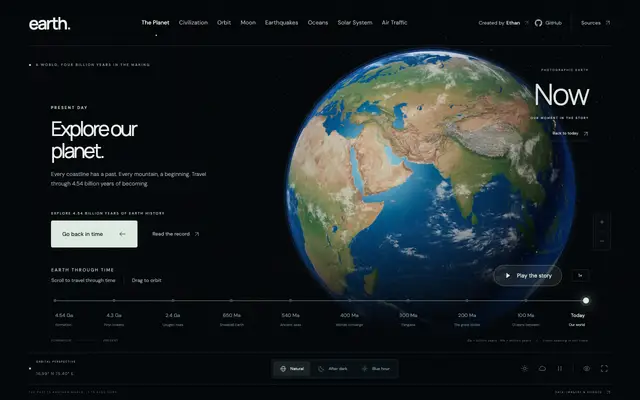
Interactive exploration of 4.54 billion years of Earth's history and geology