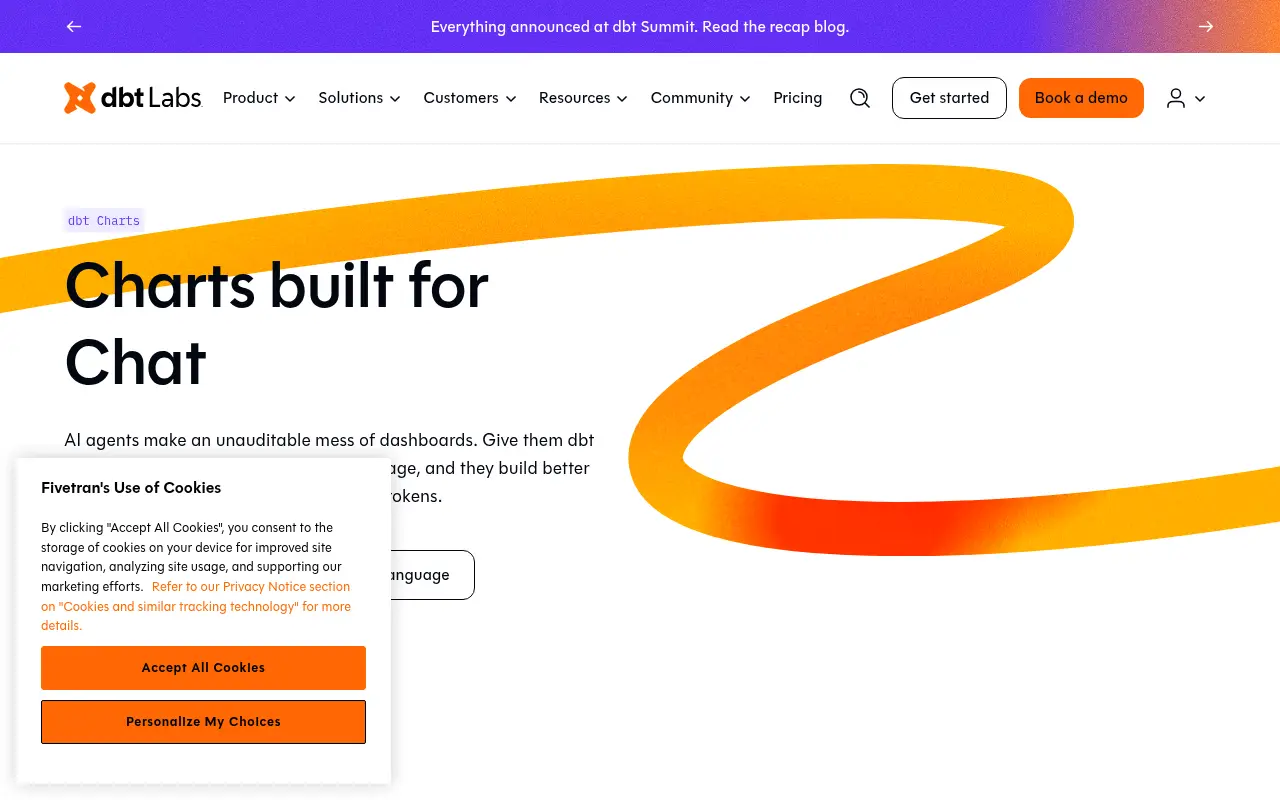
 Visit getdbt.com ↗
What is dbt Charts?
dbt Charts is an open-source YAML language and collaborative BI platform designed for building auditable dashboards. It addresses the problem of AI agents creating unauditable dashboards by providing a declarative language where queries, charts, layout, and explanations live in a single text file. The platform allows both people and agents to read, edit, and review the same file, with validation in CI and query checks against dbt models or the warehouse.
The tool works as a language-first system where boards are created as YAML files that live alongside dbt models in version control. It includes a visual editor for conversational analytics, supports running boards locally, in CI, and on the platform, and offers collaborative features with permissions. Built with Claude-code, it's available as open-source (Apache 2.0) and as a hosted platform.
Momentum
Daily activity over the last 30 days: upvotes, unique visits, new GitHub stars and Hacker News points.
How do we know it's vibe coded?
vibetrend discovered dbt Charts automatically. Evidence: Agent files (claude-code) in dbt-labs/dbt-charts. View source.
Similar vibe-coded apps
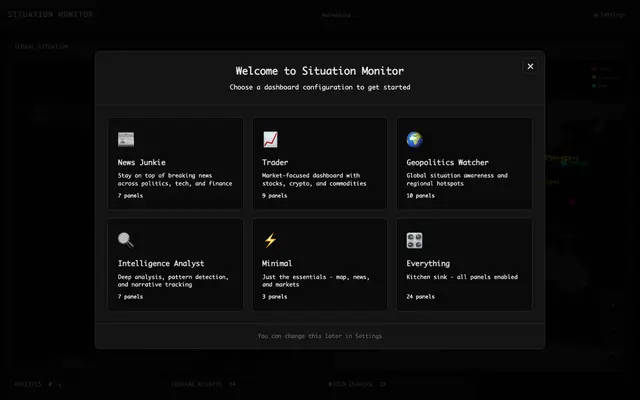
Real-time dashboard for global news, markets, and geopolitical events
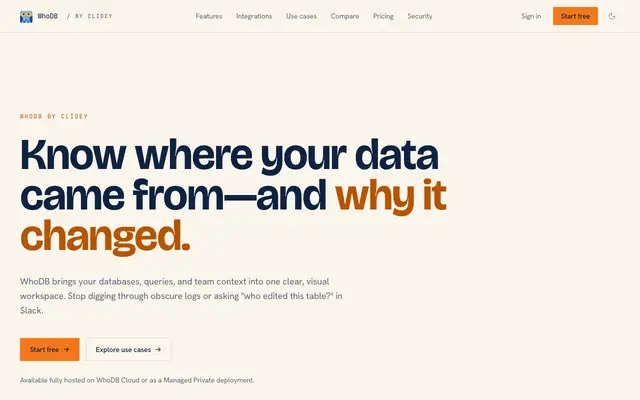
Database workspace for exploring data lineage, pipelines, and team workflows
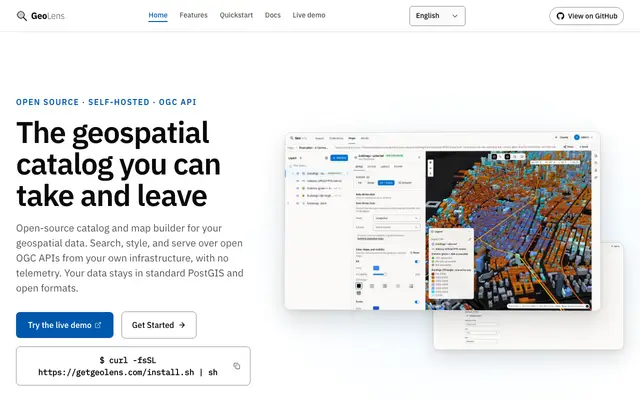
Self-hosted geospatial data catalog with semantic search and map builder
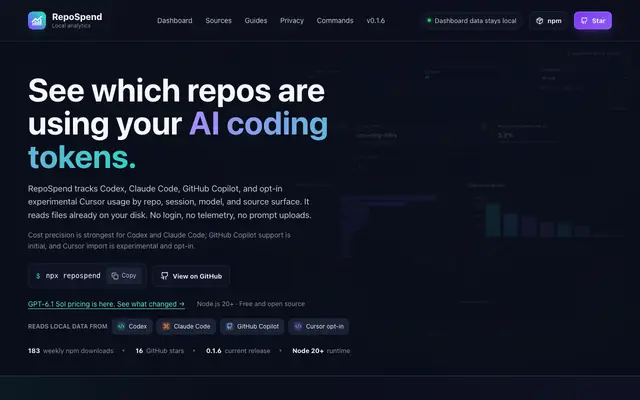
Local dashboard tracking AI coding token usage and costs by repository

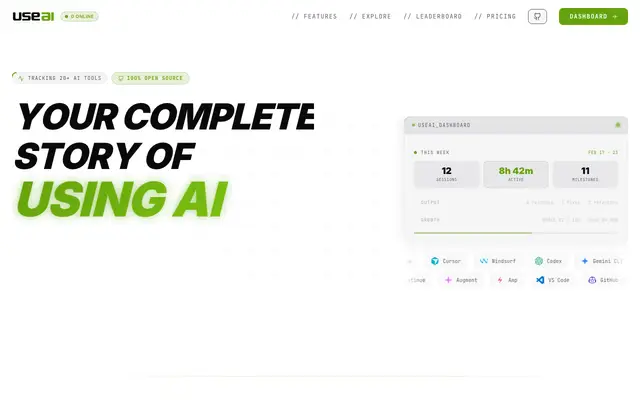
BI tool that turns Claude Code prompts into live dashboards
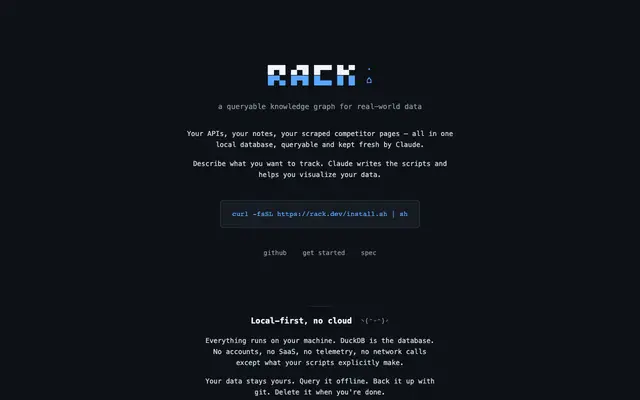
Local queryable database for APIs, notes, and data—operated by Claude
 #2 this week