Skip to content
vibetrend

BookGraph

Interactive visualization of literary citations across 3,000 years
–
Today
–
7 days
–
30 days
thiagolira.github.ioOpen live site ↗
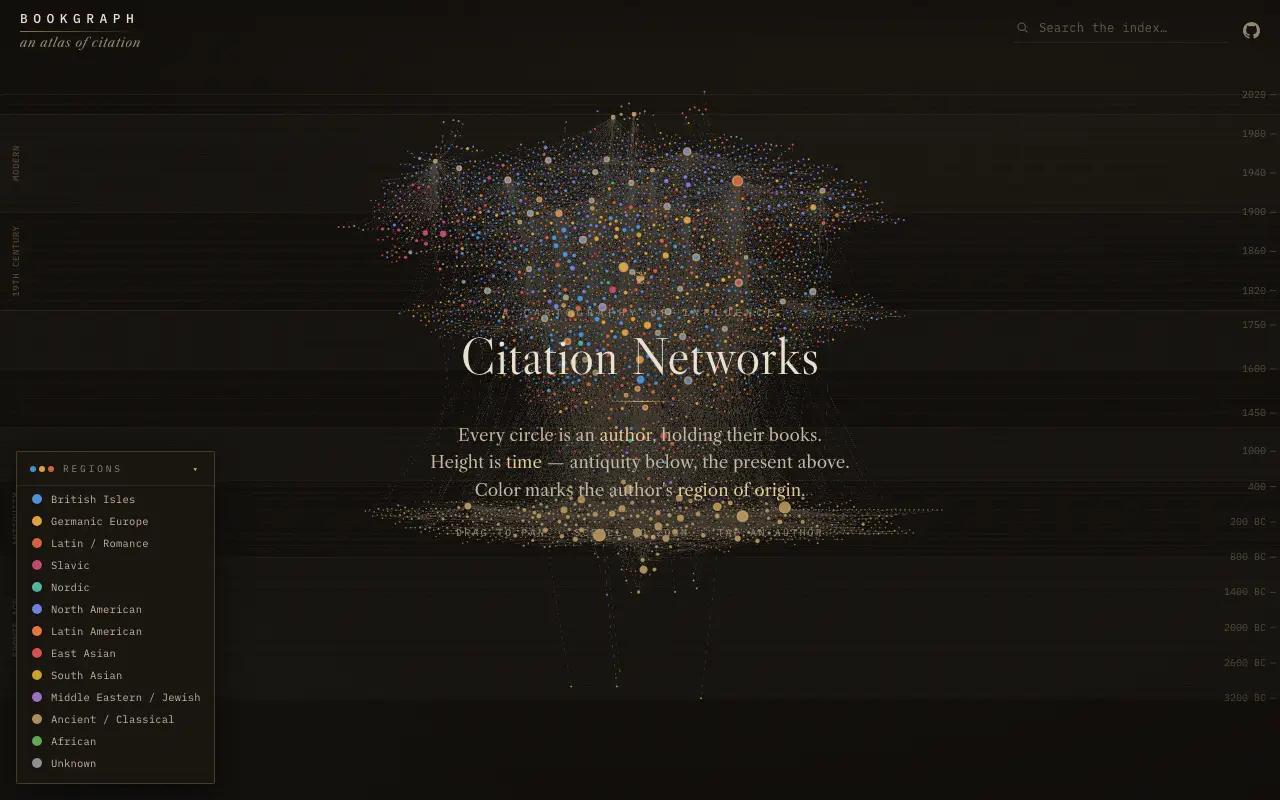
Screenshot of BookGraph homepageVisit thiagolira.github.io ↗

What is BookGraph?

BookGraph is an interactive atlas mapping how books and authors reference each other throughout history. Users explore a network where each circle represents an author, positioned by era and colored by region of origin. The interface supports panning and zooming to navigate thousands of citation connections.

The project combines an LLM-powered pipeline that extracts citations from books and resolves them against Wikipedia and Goodreads databases, with a WebGPU and D3.js visualization layer. The maker reports using Claude Code to build the browser-based visualization tool, enabling comfortable exploration of bibliographic data spanning centuries.

Momentum

Daily activity over the last 30 days: upvotes, unique visits, new GitHub stars and Hacker News points.

2026-09-29: 0 upvotes, 0 visits, 0 stars, 0 HN points2026-09-30: 0 upvotes, 0 visits, 0 stars, 0 HN points2026-10-01: 0 upvotes, 0 visits, 0 stars, 0 HN points2026-10-02: 0 upvotes, 0 visits, 0 stars, 0 HN points2026-10-03: 0 upvotes, 0 visits, 0 stars, 0 HN points2026-10-04: 0 upvotes, 0 visits, 0 stars, 0 HN points2026-10-05: 0 upvotes, 0 visits, 0 stars, 0 HN points2026-10-06: 0 upvotes, 0 visits, 0 stars, 0 HN points2026-10-07: 0 upvotes, 0 visits, 0 stars, 0 HN points2026-10-08: 0 upvotes, 0 visits, 0 stars, 0 HN points2026-10-09: 0 upvotes, 0 visits, 0 stars, 0 HN points2026-10-10: 0 upvotes, 0 visits, 0 stars, 0 HN points2026-10-11: 0 upvotes, 0 visits, 0 stars, 0 HN points2026-10-12: 0 upvotes, 0 visits, 0 stars, 0 HN points2026-10-13: 0 upvotes, 0 visits, 0 stars, 0 HN points2026-10-14: 0 upvotes, 0 visits, 0 stars, 0 HN points2026-10-15: 0 upvotes, 0 visits, 0 stars, 0 HN points2026-10-16: 0 upvotes, 0 visits, 0 stars, 0 HN points2026-10-17: 0 upvotes, 0 visits, 0 stars, 0 HN points2026-10-18: 0 upvotes, 0 visits, 0 stars, 0 HN points2026-10-19: 0 upvotes, 0 visits, 0 stars, 0 HN points2026-10-20: 0 upvotes, 0 visits, 0 stars, 0 HN points2026-10-21: 0 upvotes, 0 visits, 0 stars, 0 HN points2026-10-22: 0 upvotes, 0 visits, 0 stars, 0 HN points2026-10-23: 0 upvotes, 0 visits, 0 stars, 0 HN points2026-10-24: 0 upvotes, 0 visits, 0 stars, 0 HN points2026-10-25: 0 upvotes, 0 visits, 0 stars, 0 HN points2026-10-26: 0 upvotes, 0 visits, 0 stars, 0 HN points2026-10-27: 0 upvotes, 0 visits, 0 stars, 0 HN points2026-10-28: 0 upvotes, 0 visits, 0 stars, 0 HN points
30 days agotoday

How do we know it's vibe coded?

vibetrend discovered BookGraph automatically. Evidence: HN post: "A WebGPU + D3.js powered visualization tool written by Claude Code". View source.

Similar vibe-coded apps

OpenDesign screenshot#7 this week
OpenDesign

Open-source design workspace that turns coding agents into a local design engine

Claude Code★ 105k GitHub stars
UI UX Pro Max screenshot#10 this week
UI UX Pro Max

AI-powered design intelligence toolkit for building professional interfaces
Claude Code★ 142k GitHub stars
Introduction screenshot
Introduction

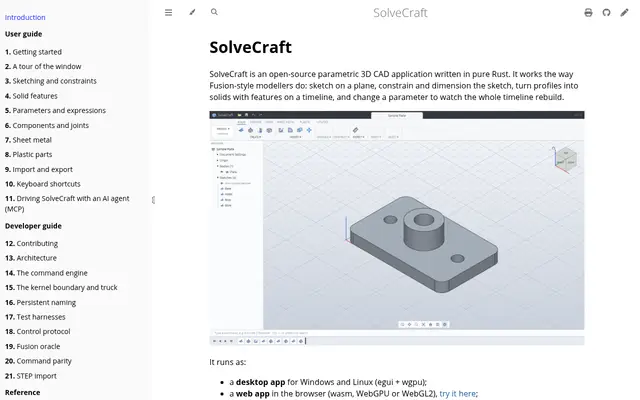
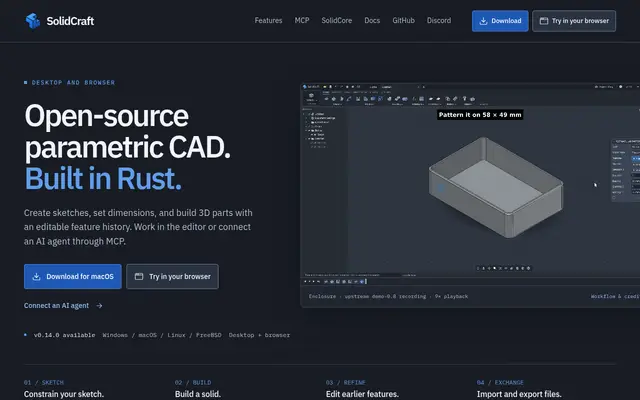
Open-source parametric 3D CAD in Rust, runs desktop, browser, CLI, and MCP
Claude Code★ 12k GitHub stars
M3E Canvas screenshot
M3E Canvas

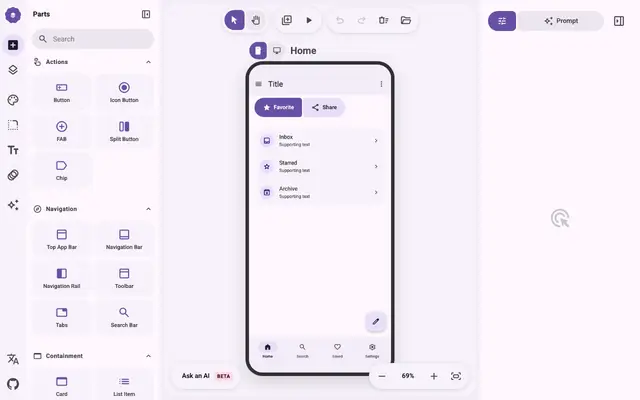
Sketch Material 3 screens in the browser, generate AI coding prompts

Claude Code★ 9.8k GitHub stars