Quint Visualizer
Interactive graph visualizer for Quint simulation traces
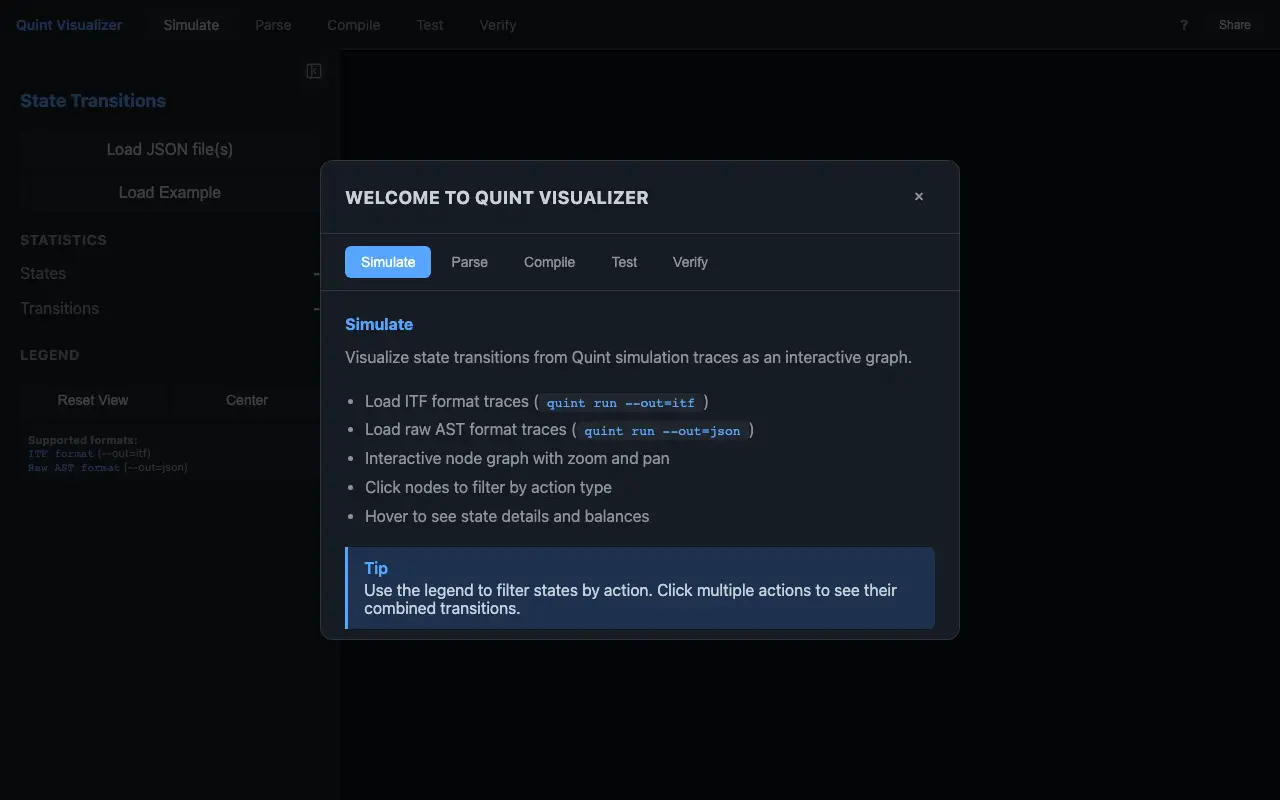 Visit quint-visualizer.noghartt.dev ↗
What is Quint Visualizer?
Quint Visualizer is a web tool for exploring state transitions from Quint formal specification traces. It displays simulation results as an interactive node graph, letting users upload ITF format or raw AST JSON files and navigate the state space visually. The interface supports zooming, panning, and clicking nodes to filter by action type. Hovering reveals state details and balances, while the legend helps isolate specific actions and their combined transitions.
Designed for developers working with Quint, the tool fills a gap similar to how GraphViz visualizes TLA+ state graphs. The maker says it was built with AI coding tools.
Momentum
Daily activity over the last 30 days: upvotes, unique visits, new GitHub stars and Hacker News points.
How do we know it's vibe coded?
vibetrend discovered Quint Visualizer automatically. Evidence: HN post: "So I vibecoded a small web tool that lets you upload a valid JSON file". View source.
Similar vibe-coded apps

Free disk cleaner and storage analyzer for macOS, Windows, and Linux

Remote browser infrastructure and agents for AI automation tasks
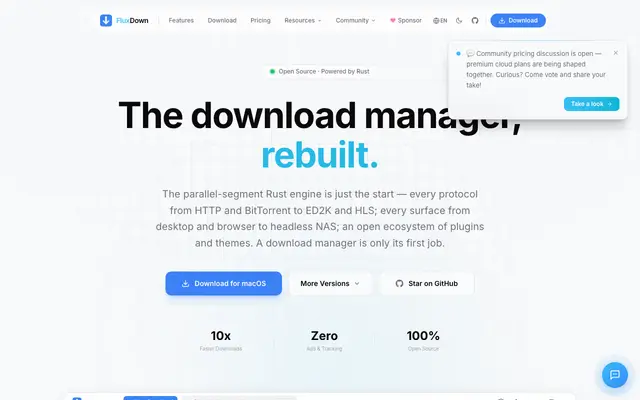
Multi-protocol download manager built in Rust with browser integration

Local proxy to run any LLM with Codex, Claude Code, and Claude Desktop
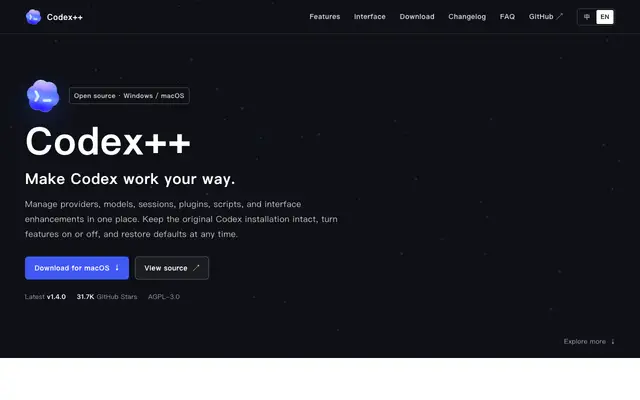
Open-source launcher and manager for OpenAI Codex desktop app
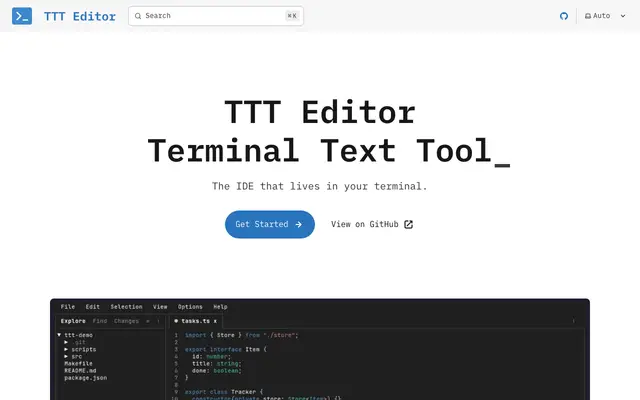
Terminal text editor with GUI-like interface and IDE features


Desktop widget tracking token usage and costs across 40+ AI coding tools